How to export large number of rows from Power Platform - The easy way


So you need to export a large number of rows from Power Platform or more specifically Dataverse. You might need to extract data from more than one table, join, transform, map, cleanup as well. Usually after going through the requirements, one of the first things that comes to mind is which tool is the right one to do this. Are you going to use a full-fledged Azure Synapse or Data Factory or the ancient SSIS? Do they have limitations or weird behaviors that can become a road blocker. You may also use my PSDataverse and PoweShell if that's your comfort zone. Today I am going to show you probably the easiest yet very capable tool that you most probably already know.
Exporting data using Dataflow
You might have overlooked this, but Dataflows can also export data. When you create a dataflow, right in the beginning you need to provide a name and decide whether your dataflow is going to import data or export data. In fact when your select the checkbox "Analytical entities only", your dataflow will export data. The destination of the export will be the managed Datalake of your Power Platform environment by default, but you can also export to any Datalake linked to your Power Platform environment. You just need to choose it from the "Select destination" dropdown list.
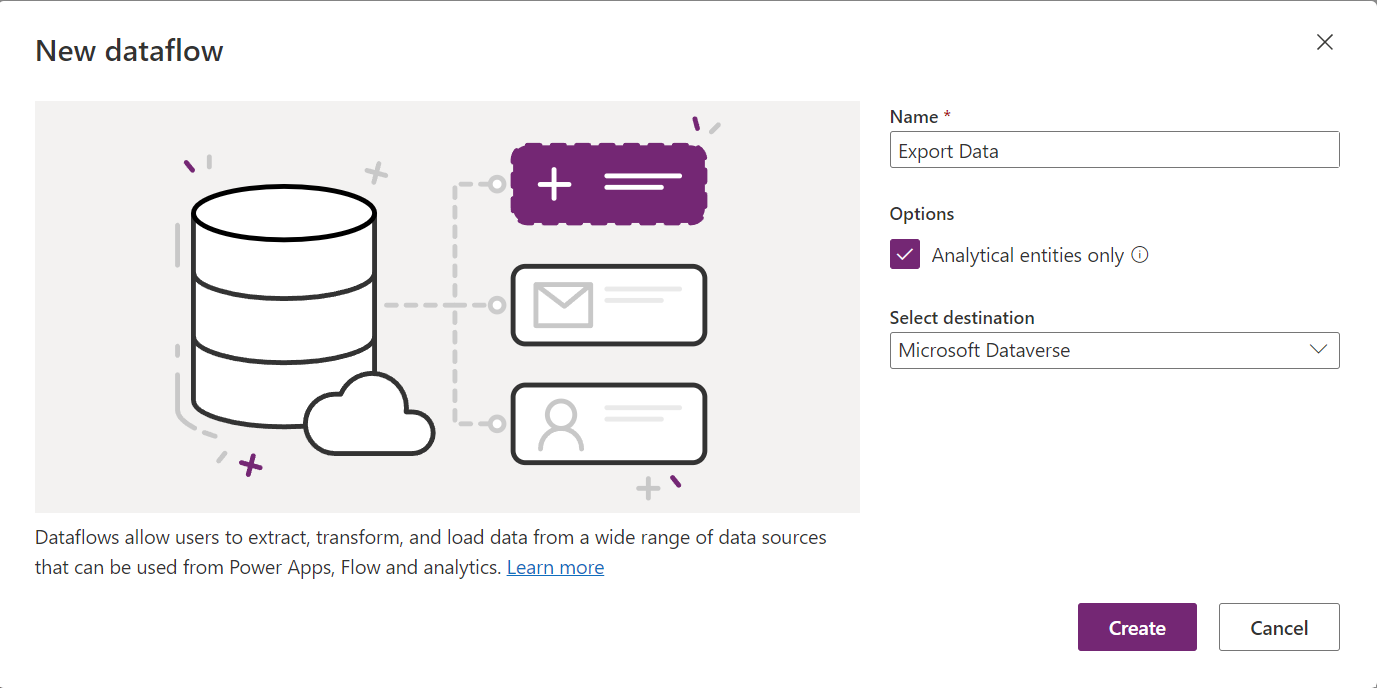
The format of data will always be CSV and your don't have the luxury to choose another format. Analytical dataflows are usually used for data cleanup and initial aggregations or transformations to be later used by other dataflows, but if you just need an export, that's what they do by default.
Accessing the exported data
If you choose to export to your own Datalake, I assume you already know where to find the exported data. Just look for a folder with the same name as your dataflow. But you have not linked any Datalake to your environment you can still access your data. The easiest way is to use Excel.have already linked your Datalake to your Power Platform environment. You just need to go to the Data tab, then Get Data, From Power Platform, From Dataflows, like the screenshot below.
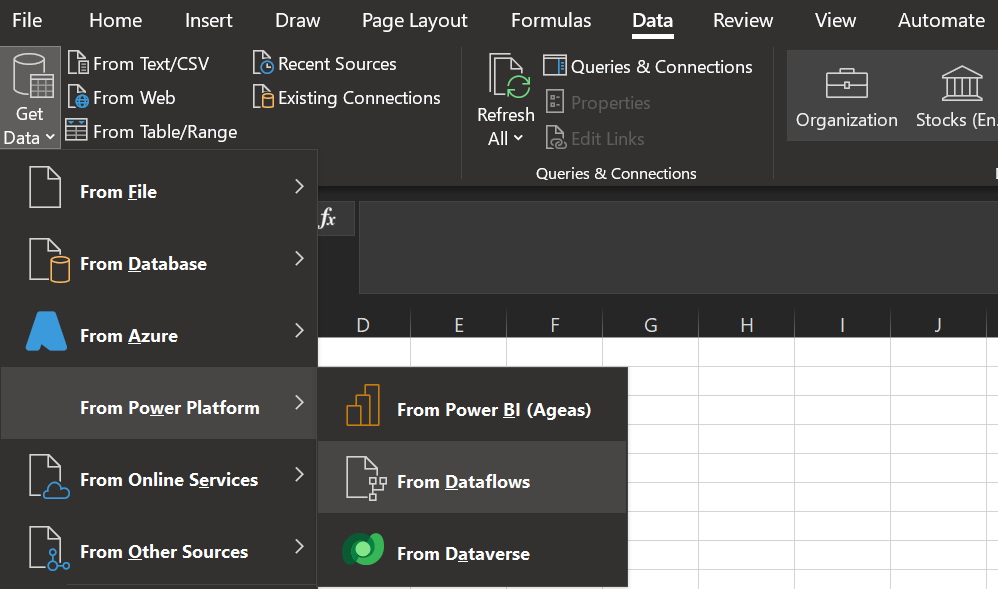
Next, you will be presented with a list of all your Power Platform environments. If you expand an environment, you will see a list of your "analytical" dataflows. Then you'll get your data. You can even transform it once more in Excel or export it to the format you want.
The Catch
You might be wondering this looks like the easiest yet capable data export. With Power Query (i.e. M Language) in your pocket, sky is the limit. Plus, it's even free! So, what's the catch? Well, depending on the amount of data, your query might timeout. It is not clear nor documented what is the limit. In one case the limit was when I had more than ten thousand rows. I am currently following up a Microsoft Support ticket on this and I will update this post if I receive more information about it. But fear not, that there is an easy workaround in two flavors.
Going beyond the limit
If you ever encountered the timeout issue you will need to start thinking about splitting your data and making your dataflow parametric. The idea is to make your query parametric and then call this query multiple times, then merge the result at the end if needed. It can be done in minute. We have Power Query at our disposal after all.
Making your query parametric
Lets continue with an example. Let's say your are exporting accounts and your have "createdon" among the columns. If you have a date column in your result set, you can convert your query to a function with start date and end date parameters, then call this query multiple times to export the data. Imagine your dataflow looks like the following example.
let
Source = CommonDataService.Database("test.crm4.dynamics.com", [CreateNavigationProperties = null]),
Navigation = Source{[Schema = "dbo", Item = "account"]}[Data],
#"Filtered rows" = Table.SelectRows(Navigation, each [createdon] >= #datetime(2022,12,1,0,0,0) and [createdon] < #datetime(2023,12,01,0,0,0)),
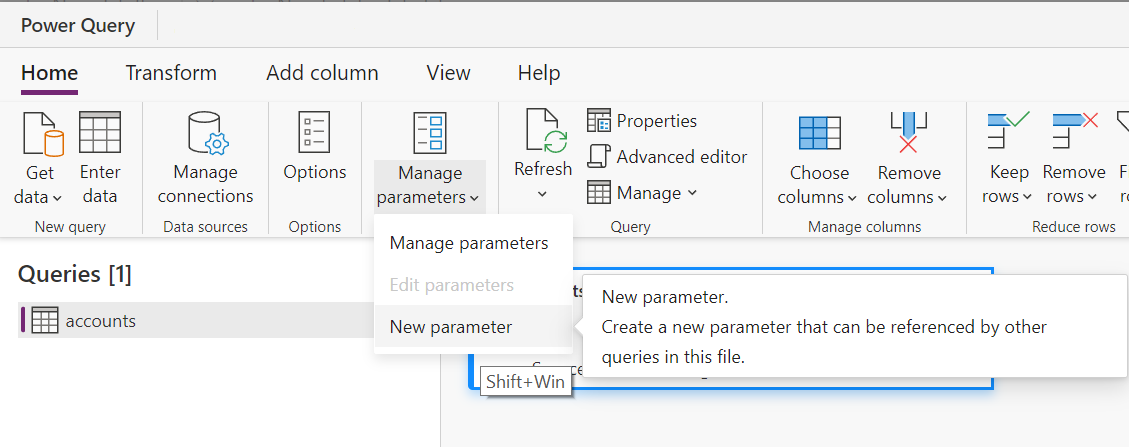
// The rest of your transformations here.in #"The last step"To make the above query parametric we first need to create two parameters. From Home tab in the ribbon, Open the "Manage parameters" and select "New parameter.
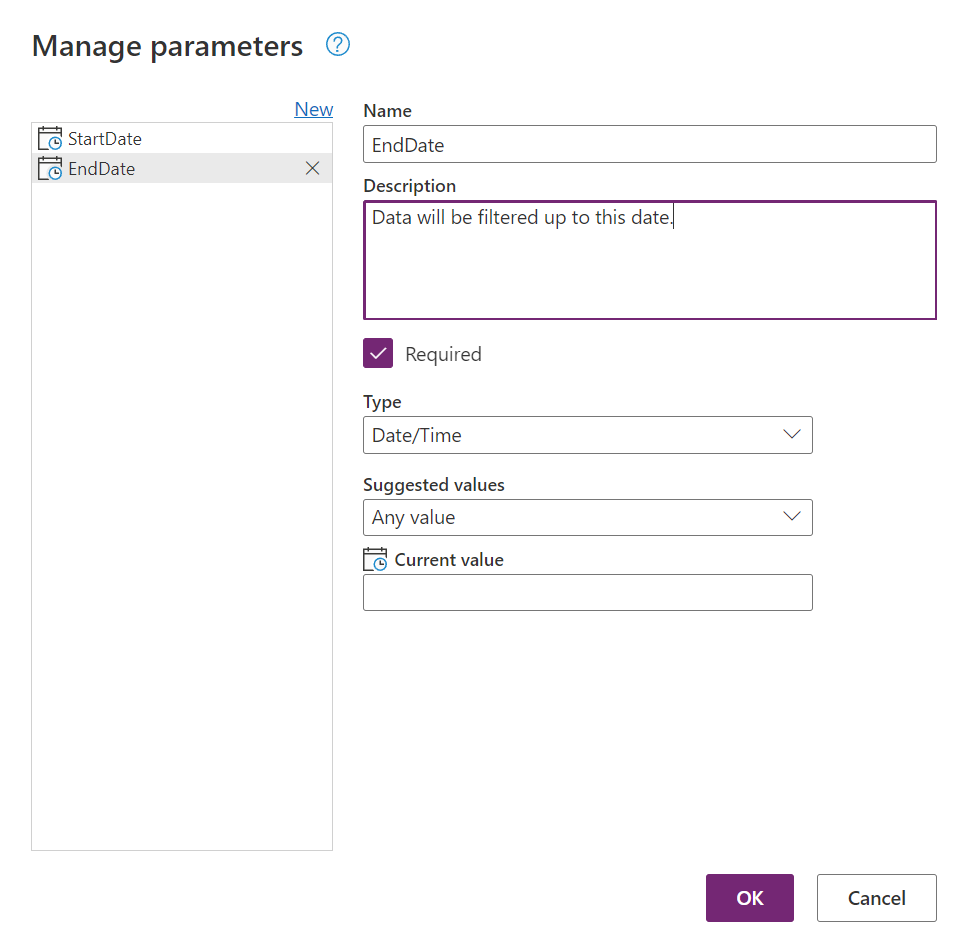
Create two new Date/Time parameters named StartDate and EndDate. The result will look like the following screenshot.
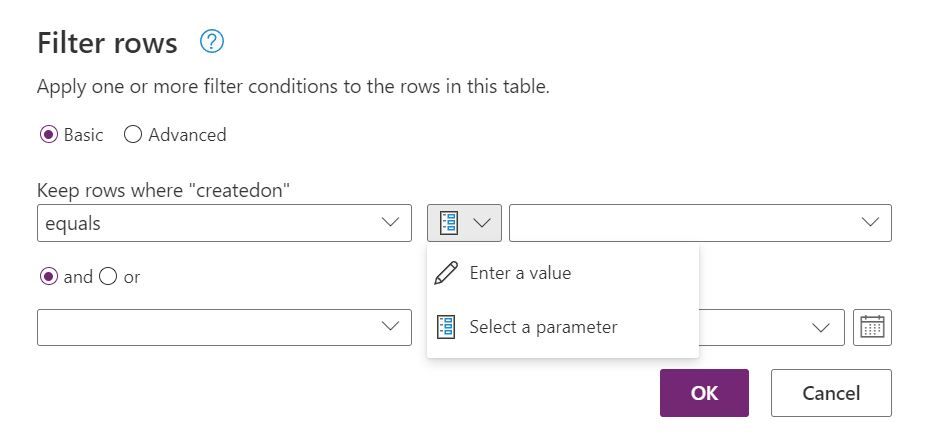
Now, you can use these parameter in your query. In fact when you create parameters, Dataflow will give your the option to use them everywhere in the UI. For example if you try to filter data, you will have access to those parameters, like the following screenshot shows.
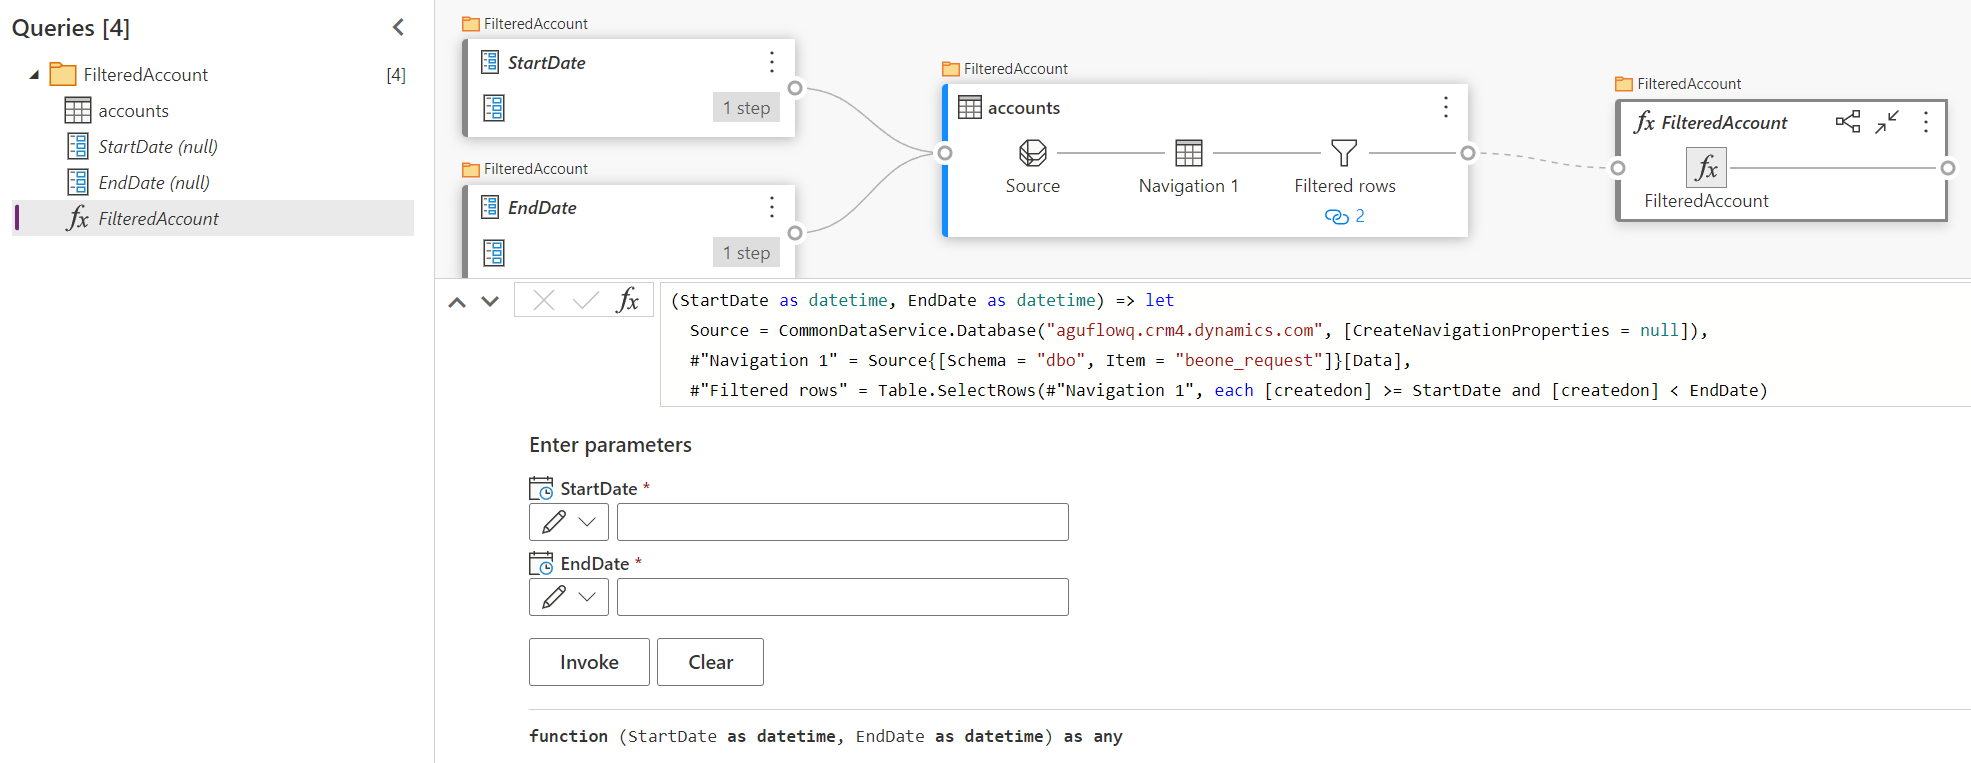
After making your query parametric either through the UI, or directly in the query step, your query will look like the following.
let
Source = CommonDataService.Database("aguflowq.crm4.dynamics.com", [CreateNavigationProperties = null]),
#"Navigation 1" = Source{[Schema = "dbo", Item = "account"]}[Data],
#"Filtered rows" = Table.SelectRows(#"Navigation 1", each [createdon] >= StartDate and [createdon] < EndDate)
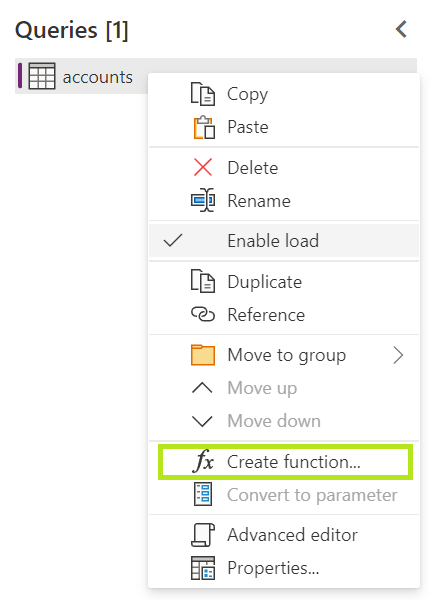
// The rest of your transformations here.in #"The last step"The next step is to right-click on your query, and choose "Create function..." from the context menu. Just like the following screenshot.
Then your will give your function a name, and the result will look like the following screenshot.
Sequential Partitioning
The easiest way to use the above query to retrieve all the data is to call it in a loop. Do you know how to create loops in Power Query? If not, just read the following example.
let
  Source =  List.Generate(
    () => [DateStart = #datetime(2023,1,1,0,0,0), DateEnd = #datetime(2023,1,1,0,0,0) + #duration(15,0,0,0)],
    each [DateEnd] < #datetime(2023,12,2,0,0,0),
    each [DateStart = [DateStart] + #duration(15,0,0,0), DateEnd = [DateEnd] + #duration(15,0,0,0)],
    each FilteredAccount([DateStart], [DateEnd])),
  Result = Table.Combine(Source)
in
  Result
In the above example, we are just creating a list of start and end dates, starting from 2023, January 1 and adding 15 days each time. Then per each item in the list we are calling the function, and finally combining the outcome as a table. The only down side in this way of partitioning is that the queries will run sequentially and it might take significant time, if you have several hundreds of thousands of rows to export.
Parallel Partitioning
To get the best performance you will need to partition the queries in parallel. You might already know that Power Query runs all the queries that have no dependencies on each other in parallel. This means that you will need to create multiple queries and in each query call the function with different dates. Each query will look similar to the following example.
FilteredAccount(#datetime(2023,1,1,0,0,0), #datetime(2023,1,15,0,0,0))You will need to give each query a name and at the end, you will need to write an extra query to combine them all. The combining part can also be done in a different dataflow, or in the Excel if you are going to use that to download the result.